Senior-and-Above Compensation in Tech
How well does tech pay, really? A deep look into almost 1,000 data points sent in by engineering managers, senior+ engineers, VP, and C-level folks in tech, mostly working in software engineering
In April 2023, I invited senior-and-above readers to share their compensation numbers, to research an accurate account of pay at startups, scaleups, and publicly traded companies. The survey was a collaboration with VC firm Creandum, which created an interesting report about early-stage compensation in Europe. Creandum shared a report, based on this data last year: Compensation Decoded: Tech leader salaries at early-stage startups.
I’m delighted to share what – I hope – is the most detailed-possible tech compensation report based on latest-available figures. I’ve taken time to slice and dice the data; so strap in because today we’re talking numbers – lots of them! We cover:
Overview of sources. 951 data points, mainly from engineering managers and senior+ engineers in the US, EU and UK.
Base salary, cash compensation, total compensation. A summary of how these compare at the 75th and 90th median percentiles.
Regional pay comparison. Unsurprisingly, the US pays best by quite a distance. However, other regions pay $200K+ in total compensation at the 75th percentile.
Compensation by seniority. How seniors with 5-10 years of experience, those with 10+ years, and executives, are paid across the globe: US, UK, EU, India, Asia, Australia and New Zealand, Latin America, Africa.
Compensation by funding stage. Pay at bootstrapped, early-stage, mid-stage, late-stage and public companies in the US, EU and UK.
A closer look at the 90th percentile, by funding stage. Something odd is happening to executive packages at late-stage companies: it’s extremely high!
Outliers. The top 3 data points from each category of founders, non-founder executives, and publicly traded companies execs. It’s interesting a principal engineer takes home more in cash compensation than most executives filling out the survey, in illiquid stock.
Interesting findings. Bootstrapped companies pay surprisingly well in cash terms, and neither sector nor engineering team size make a difference to how much you earn.
See also these articles related to this topic:
1. Overview of sources
After cleaning the data, the report has 951 data sources. Around two-thirds of respondents work in engineering management or engineering leadership, and nearly a third in software engineering:
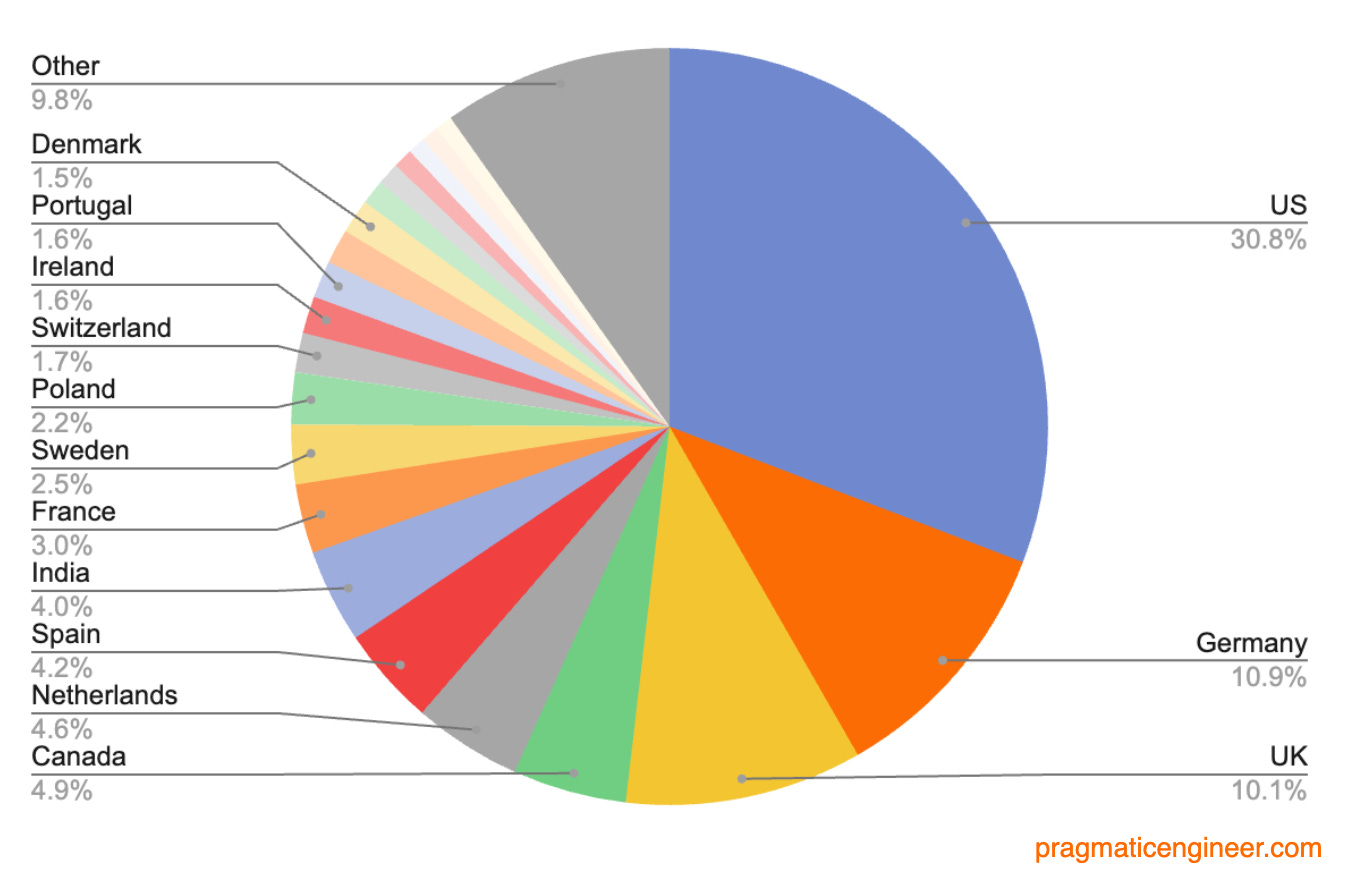
Region-wise, most of the data is from US, EU, and UK readers, but responses came in from every continent on earth – except Antarctica!
Top 20 countries by response:
2. Base salary, cash compensation, total compensation
Let’s get into the numbers, first by comparing base salary data across all regions. Base salary is the part of your compensation that’s guaranteed, no matter performance or other factors. In the US, Canada, Australia and most of Latin America this is usually paid fortnightly, while in most of the EU and the UK it’s often once per month.
Here’s a cross-region comparison, with the median, 75th and 90th percentiles in US dollars:

Total cash compensation is base salary plus cash bonus (usually at the end of the year) and any sign-on bonus. You can’t guarantee to definitely get your total cash compensation, but knowing some numbers might help in negotiations:
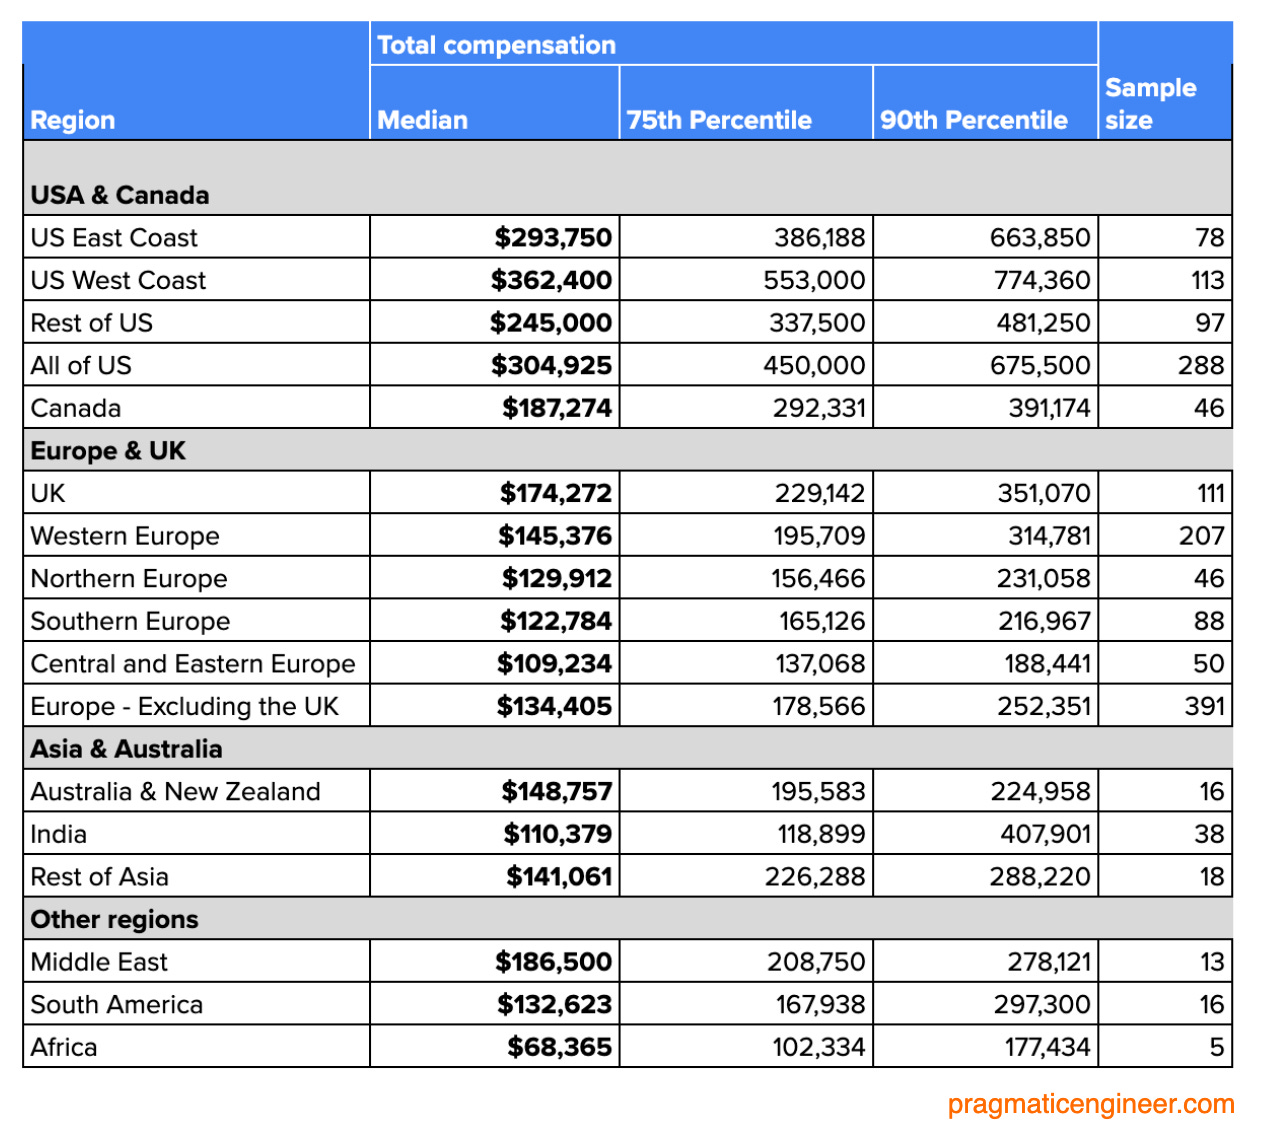
Total compensation is cash total compensation, plus equity grant. This equity can be illiquid at privately traded startups and scaleups, or liquid at public companies. In context, ‘liquidity’ refers to an asset’s ability to become cash. For liquid equity, there’s the option of selling equity on the stock market for cash after it vests – assuming there’s no “blackout” period. Illiquid equity can be sellable at a liquidation event like an acquisition, going public, or a secondary equity sale.
Breakdown by region:

3. Regional pay comparison
Let’s see all these numbers in a single chart for easy comparison:


