
How tech companies measure the impact of AI on software development
How do GitHub, Google, Dropbox, Monzo, Atlassian, and 13 other companies know how well AI tools work for devs? A deepdive sharing exclusive details, with CTO Laura Tacho


Hi – this is Gergely with the monthly, free issue of the Pragmatic Engineer Newsletter. In every issue, I cover challenges at Big Tech and startups through the lens of senior engineers and engineering leaders. If you’ve been forwarded this email, you can subscribe here.
Many subscribers expense this newsletter to their learning and development budget. If you have such a budget, here’s an email you could send to your manager. If you’re not a full subscriber, you missed several deepdives and The Pulse issues.
AI coding tools are widespread across tech, with 85% of software engineers using them at work, according to our 2025 tooling survey. But things like tokens aren’t exactly cheap, and companies are spending more on AI tools. So, how do companies measure whether or not they are worth the money?
To find out, I turned to Laura Tacho, CTO at DX, which helps companies to measure engineering efficiency. Longtime readers may remember Laura from three years ago, when she shared thoughts on measuring developer productivity and gave suggestions for how to get started in this tricky field, in her deepdive Measuring Developer Productivity.
In this article, we cover:
How 18 tech companies measure AI impact. Details from Google, GitHub, Microsoft, Dropbox, Monzo, and many others. Details on the metrics measured; for example, how GitHub measures AI time savings, pull request (PR) throughput, change failure rate, engaged users, innovation rate, and more.
Solid foundations matter for measuring AI impact. You can – and should! – use existing “core” metrics, together with AI-specific ones like customer satisfaction (CSAT) scores.
Break down metrics by AI-usage level. Track metrics over time to see trends and patterns. Start with solid baseline measurements, slice and dice the data, and have an experimental mindset when measuring impact.
Stay vigilant about maintainability, quality, and developer experience. Track metrics that keep each other in check: for example, by tracking both Change Failure Rate and PR throughput.
Unique metrics, interesting trends. Microsoft measures “bad developer days,” while Glassdoor measures experimentation outcomes from AI tools. It’s likely that more teams will measure data on how autonomous AI agents perform.
How to measure AI impact? An overview of the DX AI framework, and tips for getting data via systems data, periodic surveys, and experience sampling.
How Monzo measures AI impact. It’s tough to pull “proper” data because AI tooling vendors often hoard it. AI tools work really well with migrations, and offering great AI tools can give a competitive advantage to hire and retain great engineers, and more.
Disclaimer: I am an investor in DX, of which Laura is CTO, but this article is not paid for by DX or sponsored in any way. In fact, I reached out to Laura about taking part. Read more in my ethics statement. Related deepdives on measuring developer productivity:
Measuring developer productivity: real-world examples (2024)
Measuring developer productivity? A response to McKinsey – with Kent Beck (2023)
How LinkedIn measures software engineering efficiency (2022)
With that, it’s over to Laura.
Open up LinkedIn, and it only takes about 30 seconds to stumble across a post about AI changing how companies develop software. There are headlines about companies, mostly US-based Big Tech, supposedly shipping huge amounts of AI-generated code – Google with 25%, Microsoft with 30% – with reports implying all this code lands in production, and some founders say AI can replace junior engineers. On the other hand, studies like the recent METR study about AI’s impact on open source software tasks, find that AI can mess with our time perception and actually slow us down, even when we think we’re moving faster.
When it comes to showing AI impact, the headlines are pretty one-dimensional. AI can write a lot of code which saves time – or does not. Meanwhile, we’re careening toward the biggest pile of tech debt the world has ever seen.
I’m often left wondering why our industry has become fixated on lines of code (LOC) again; why is this the metric in the headlines? What about quality, innovation, time-to-market, and reliability? We agreed a long time ago that LOC is a bad measure of developer productivity, but it’s easy to measure LOC, and in the absence of a clear alternative, easy to latch on to. It also makes for good headlines.
Right now, many engineering leaders are making big decisions about AI tools without really knowing what works and what doesn’t. According to research in LeadDev’s 2025 AI Impact Report from 880 engineering leaders, 60% of leaders cited a lack of clear metrics as their biggest AI challenge. My own experience aligns with this. I have numerous conversations each week with leaders who are feeling pressure to deliver results like in the headlines, and are at the same time frustrated by boards or exec teams fixated on measuring LOC. There’s a gap between what leaders need to know and what’s being measured and talked about, and this measurement gap only widens as new tools and capabilities hit the market.
Closing this measurement gap is my job. I’ve worked on dev tools for over a decade, and since 2021, I’ve been researching and advising companies on improving developer productivity. Since joining DX as CTO two years ago, I now do this on an even larger scale, working closely with hundreds of amazing companies in the complex and important space of developer experience, engineering efficiency, and AI impact.
Earlier this year, I co-authored the AI Measurement Framework, which is a recommended set of metrics to track AI adoption and impact across engineering teams. This framework is built upon rigorous field research, as well as data analysis from 400+ companies, and how they’re actually rolling out and measuring AI tools.
Today, we’ll look into how 18 tech companies measure AI impact in the real world, giving you a peek into the research that goes into something like the AI Measurement Framework. I’ll share:
The real metrics companies like Google, GitHub, and Microsoft use to measure AI impact
How they use the metrics to figure out what’s working and what’s not
How you can measure AI impact
AI-impact metrics definitions and measurement guide
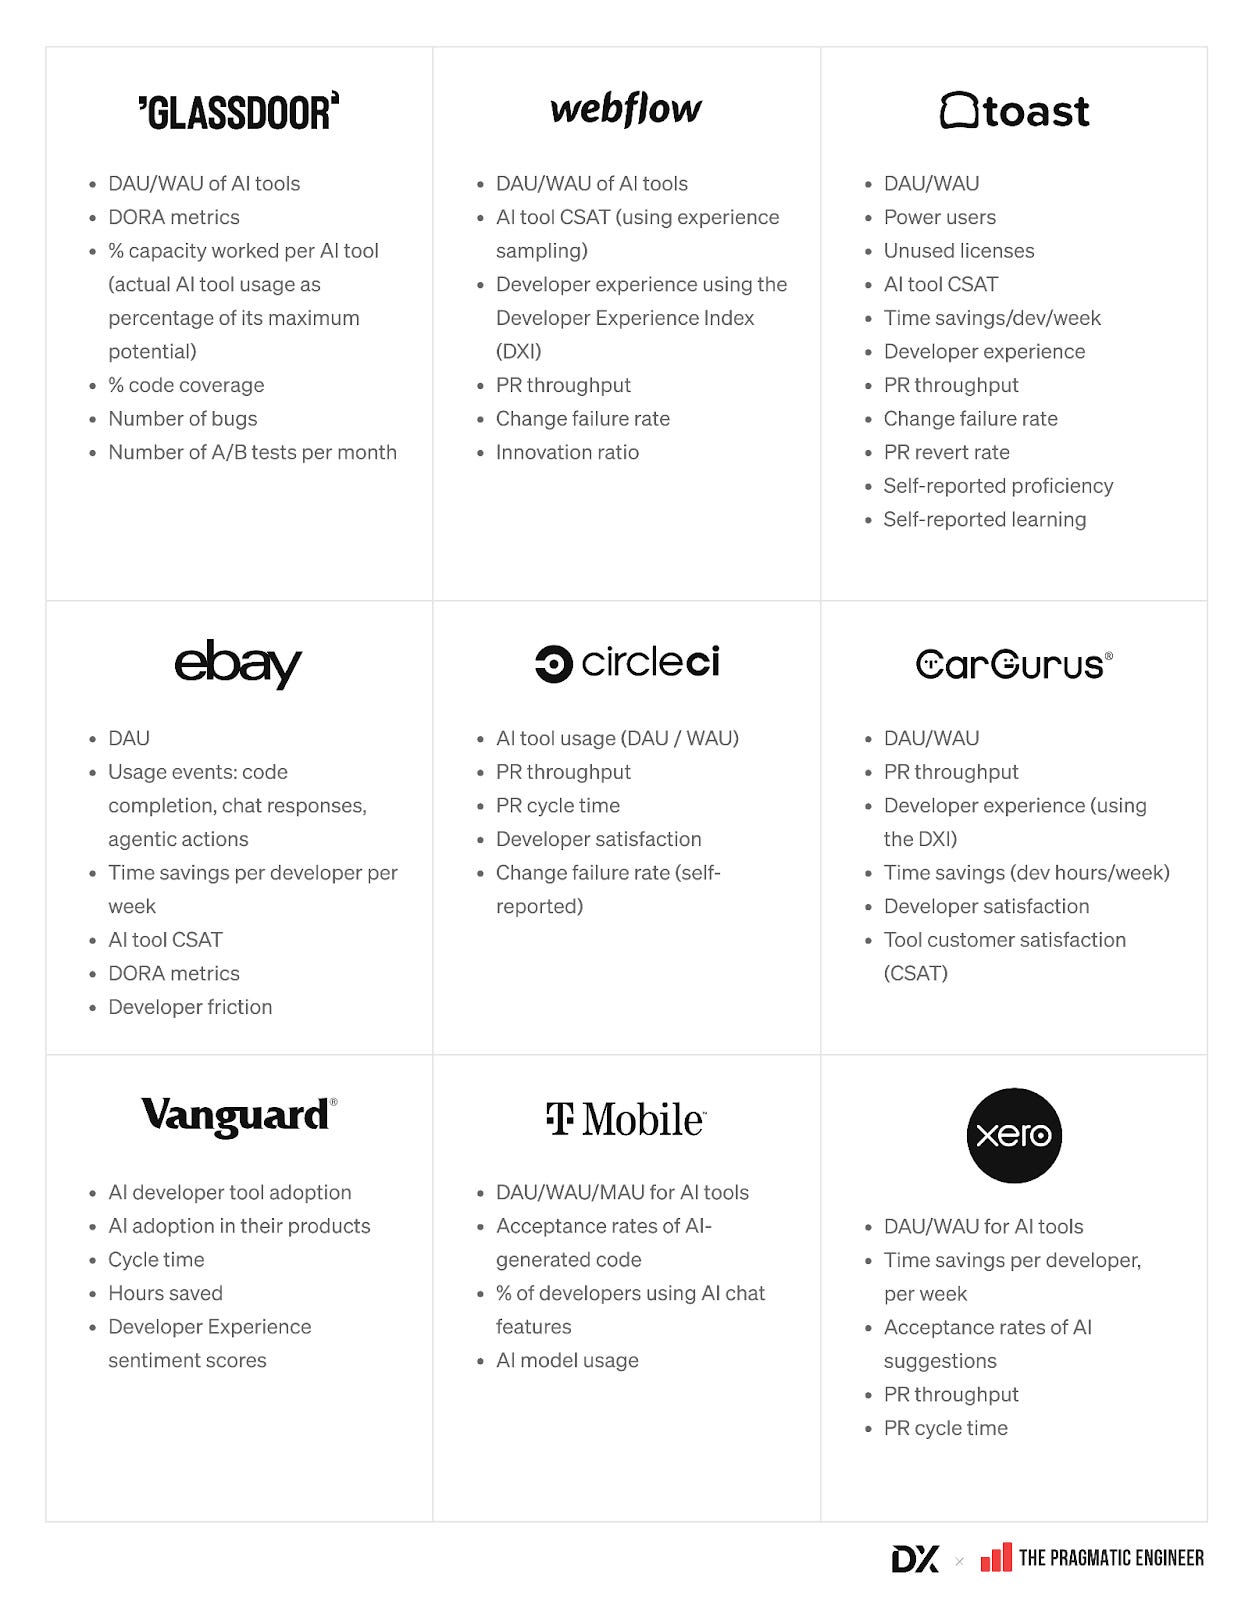
1. How 18 top companies measure AI impact
First, an overview of real metrics which 18 companies use to measure the impact of AI on their work; including GitHub, Google, Dropbox, Microsoft, Monzo, Atlassian, Adyen, Booking.com, and Grammarly:
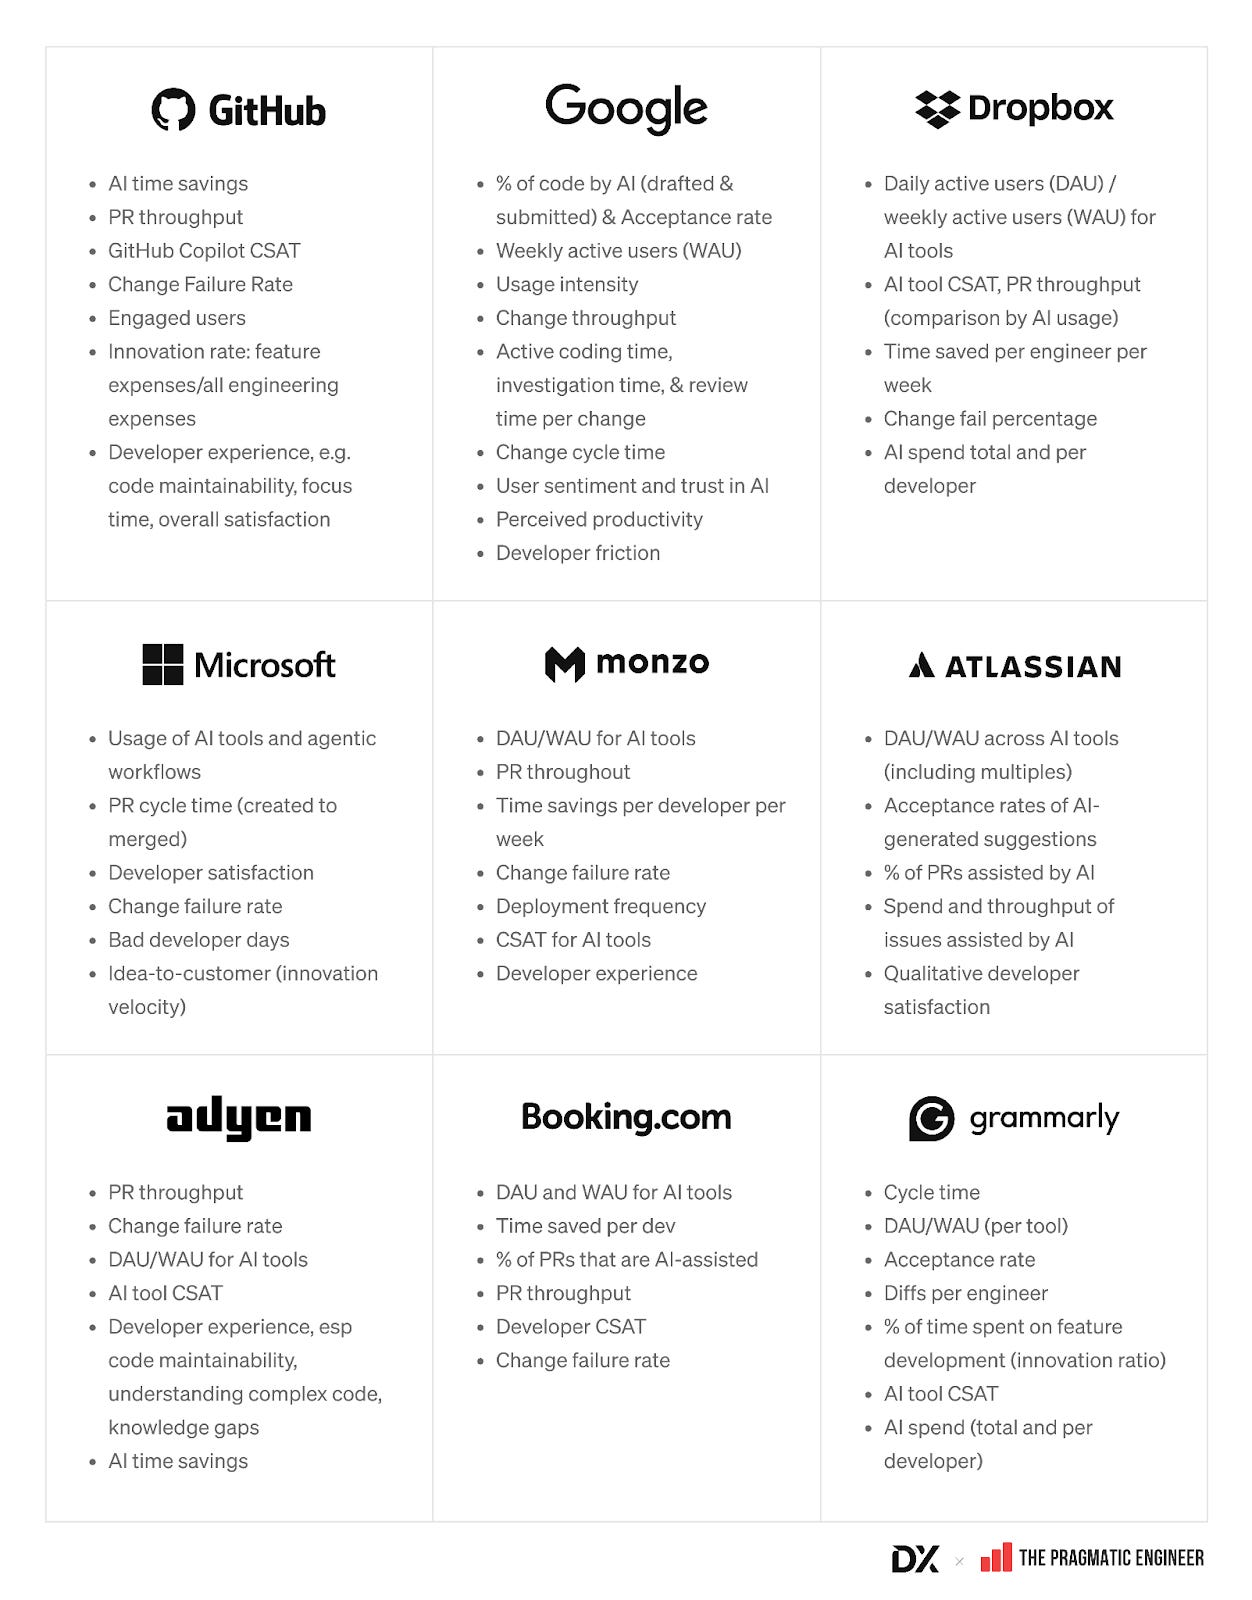
There’s a lot we can learn from the similarities and differences in the approaches shared above. Let's break it down.
2. Solid foundations matter for measuring AI impact
Using AI to write code doesn’t change the mechanics of what makes good software good, or what matters to the business. Software still needs to be high quality, easy to maintain, and delivered at speed.
That’s why you’ll notice that many of the metrics shared above look the same as in the pre-AI world, such as Change Failure Rate, PR Throughput, PR Cycle Time, and Developer Experience.
You don’t need totally new metrics to measure AI impact. Instead, focus on what’s always mattered. Is AI helping your organization get better at those things?
A hard truth is that organizations that can’t yet articulate “what matters” when it comes to engineering org performance and developer productivity, are finding it almost impossible to measure AI impact beyond surface-level metrics like LOC or acceptance rate. The 18 organizations above have already invested heavily in measuring developer productivity and developer experience, which puts them in a great position to more easily see the impact of AI tooling.
While we shouldn’t start from scratch, we do need new, targeted metrics to see exactly what is happening with AI usage. Knowing where people use it, and to what extent, influences things like decisions about budgets, tool rollouts, and enablement, all the way to SRE and security, governance, and compliance.
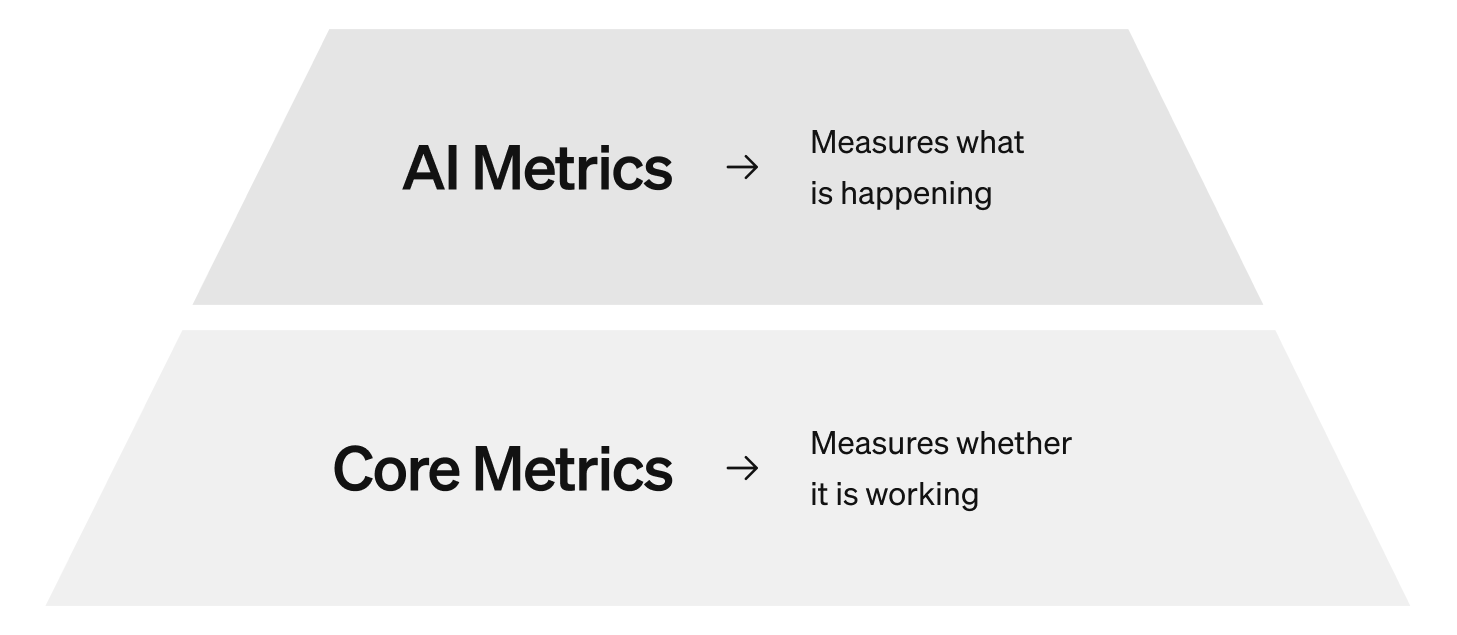
AI metrics can show:
How many and what types of developers are adopting AI tooling
How much work and what kind is being touched by AI
How much it costs
Core engineering metrics show:
If teams are shipping faster
If quality and reliability are increasing or decreasing
If code maintainability is decreasing
If AI tools are reducing friction in the developer workflow
Take a look at metrics used by Dropbox, which is a good example of mixing existing metrics with new AI-specific ones. Dropbox has an adoption rate of 90% of engineers regularly (weekly+) using AI tools, which is really high compared to the industry average of closer to 50%.
Dropbox didn’t get to this high level of adoption by relying on the curiosity and grit of individual developers. They took a structured, organizational approach that had good metrics built in from the start.
On the AI side, Dropbox tracks these metrics:
Daily and weekly active users
Customer satisfaction (CSAT) of AI tools
Time saved per engineer
AI spend
These show who exactly is using AI, what their experience is, whether it’s actually saving them time, and how much it all costs. Then by layering in the Core 4 framework, which Dropbox uses to track core engineering metrics, they can see how AI adoption affects software delivery at a larger scale. Specifically, they look at:
Change Failure Rate
PR throughput
A 90% adoption rate only matters if it benefits the organization, teams, and individuals. For Dropbox, engineers who regularly use AI merge 20% more pull requests each week, while also reducing the change failure rate. Looking at all these metrics together helps them avoid over-indexing on a single thing like adoption, and missing the wider point.
3. Break down metrics by AI-usage level
In order to better understand how AI is changing how developers get work done, Dropbox and other companies I interviewed do different kinds of analysis on their metrics, such as:
Comparing AI users with non-AI users
Comparing core engineering metrics before and after AI tools were introduced
Following the same group of users as they adopt AI and seeing what changes (cohort analysis)
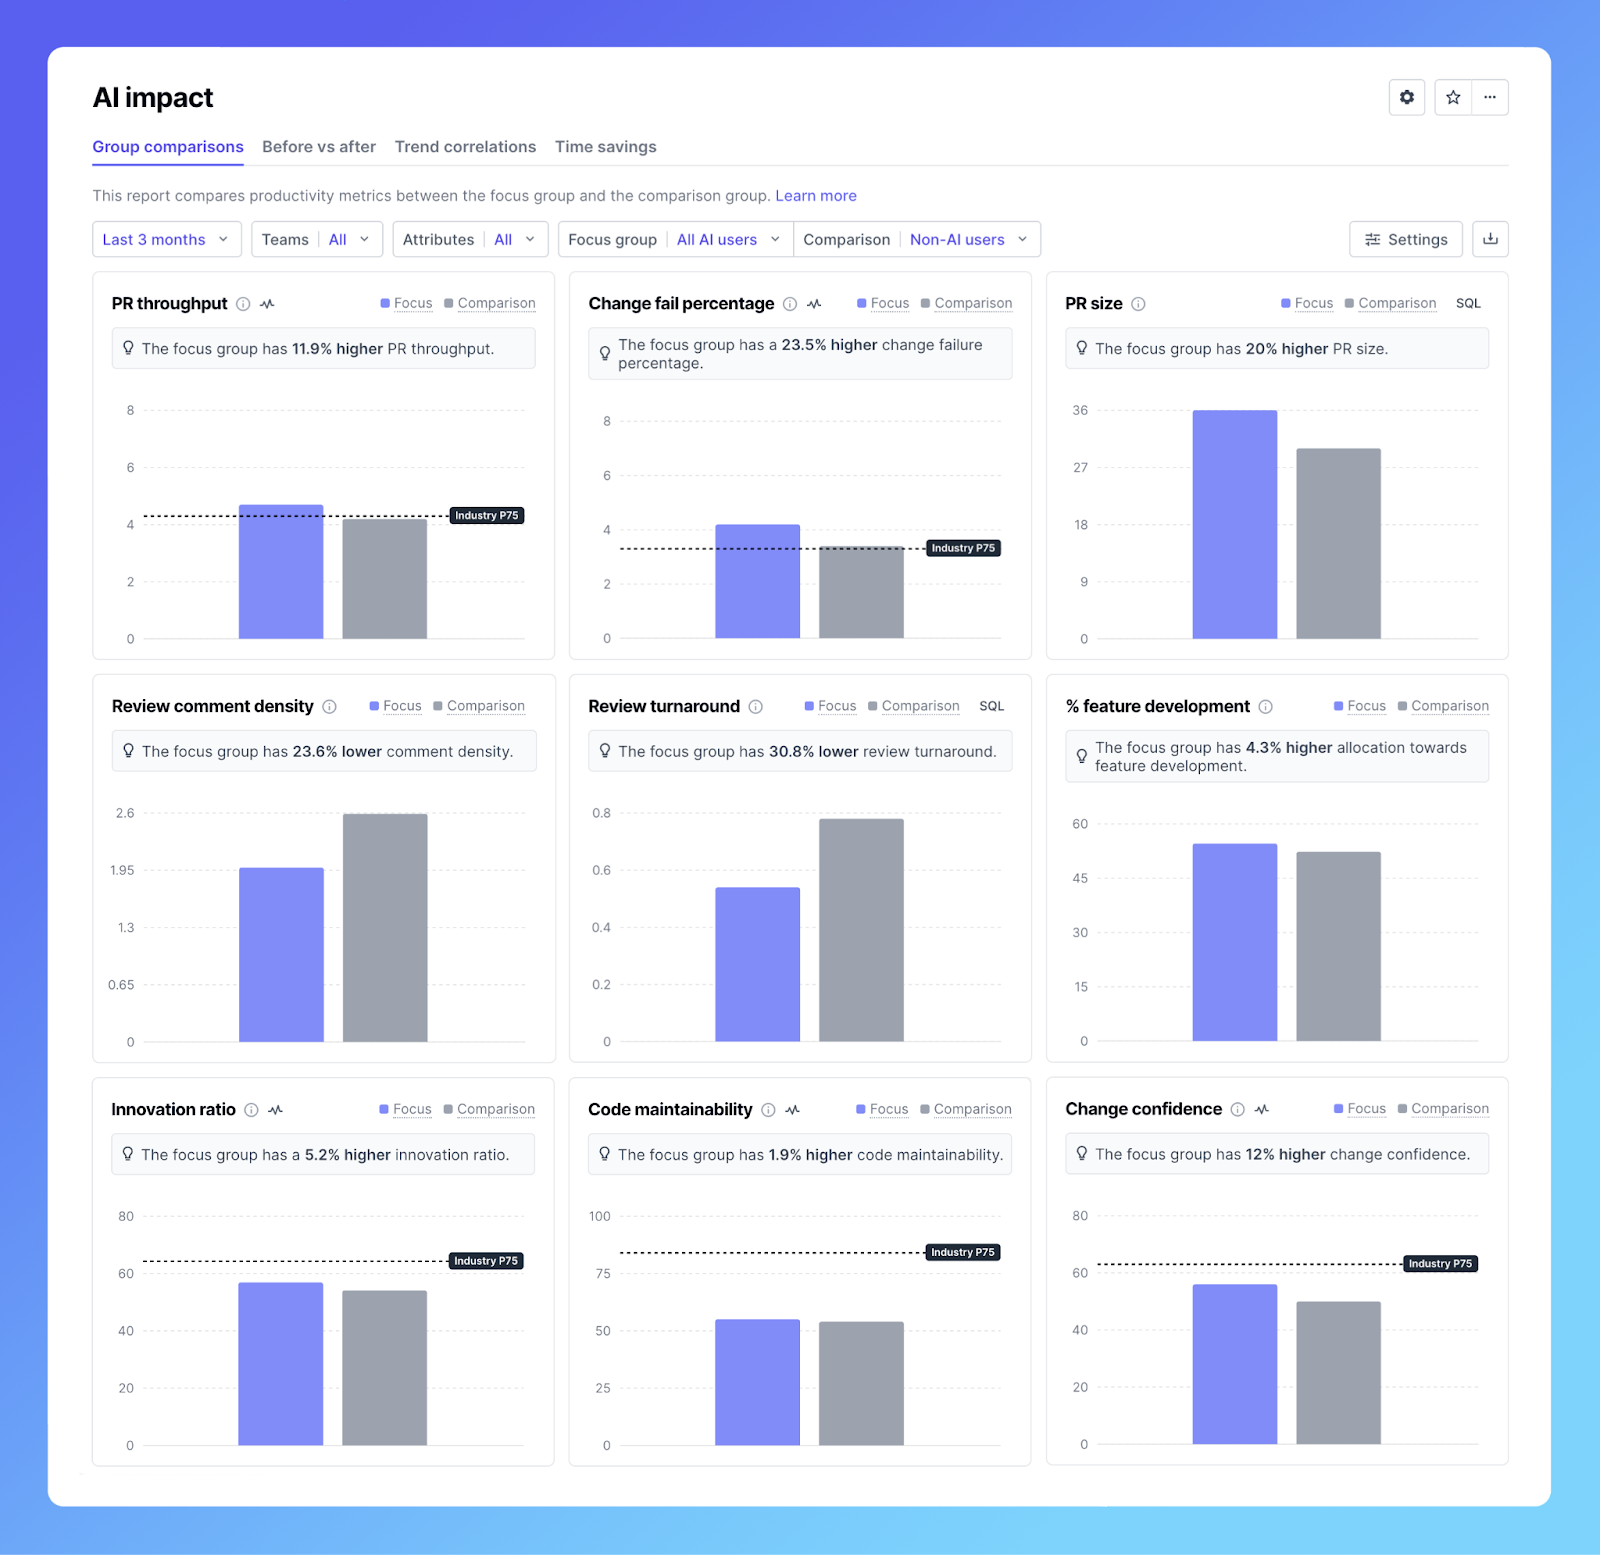
Many companies slice and dice their data to better observe patterns. This slicing and dicing is based on user attributes like role, tenure, region, and main programming language. It helps answer more detailed questions and to see important patterns, like junior engineers opening more PRs, and senior engineers slowing down because they spend more time reviewing those PRs. You can use such detailed research questions to find groups of developers who might need more training and enablement, or on the flip side, to find areas where AI is working really well and then devise a playbook for scaling those use cases.
Using this style of comparison, Webflow was able to pinpoint groups for whom using AI tools saves the most time; in this case, it was devs who have been at the company more than 3 years. Webflow uses tools like Cursor and Augment Code, and similarly to Dropbox, has seen a boost of around 20% in PR throughput for AI users vs non-AI users.
Start with solid baseline measurements if you want to do comparisons well. I mentioned earlier that companies which don’t yet have a solid footing in developer productivity will have a hard time measuring AI’s impact. I mean this theoretically and practically; first, they don’t know what signals to look for, and secondly, they don’t have good data for comparison.
If you don’t yet have great baselines, now is the time to get them. To get started quickly using the Core 4 framework (which Dropbox, Adyen, Booking.com, and others use), here is a template and instructions on how to do so. You can also use system data and experience sampling data to complement periodic surveys like this, and we’ll cover how to use those techniques later.
Taking these measurements once won’t give you much insight into AI impact; tracking them over time is what reveals trends and patterns.
I cannot overstate how important an experimental mindset is for measuring the impact of AI. One common trait shared by the companies I interviewed for this article is that they use the data to answer questions and test predictions about how AI is impacting development. In many cases, they start with a concrete goal and work backwards; they don’t expect the data to magically reveal some truth about AI impact, or tell them what to do next.
4. Stay vigilant about maintainability, quality, and dev experience
One thing that occasionally keeps me up at night is just how new AI-assisted development is. We don’t have years of longitudinal data that shows with confidence that there is no long-term risk to code maintainability or quality. And when I talk to executives and developers, a top concern of both is balancing short-term speed gains with longer-term tradeoffs like tech debt.
Track metrics that keep each other in check. You’ll see that almost every single company is tracking Change Failure Rate alongside a measure of speed like PR throughput. These metrics can keep each other in check: for example, an increase in speed and a drop in quality may be a sign that something isn’t right.
Beyond Change Failure Rate, there are other metrics I recommend tracking in order to keep a close eye on quality and maintainability. Some companies measure:
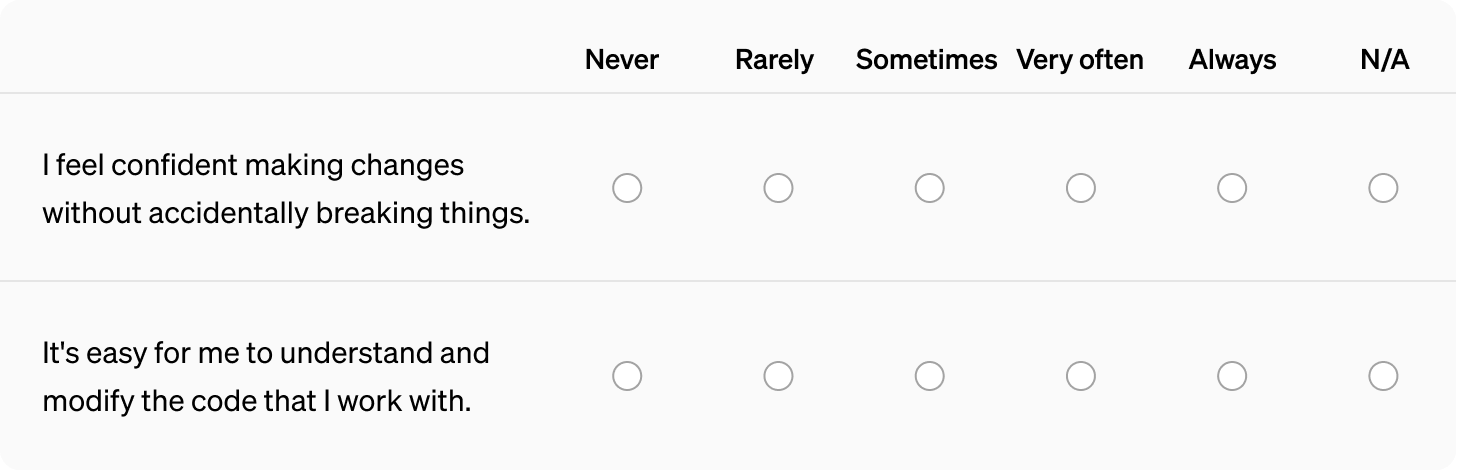
Change confidence – how confident a developer is that their change won’t break production
Code maintainability – how easy it is to understand and modify code
Perception of quality – how developers perceive the quality of code and quality practices in their teams
You need to collect system-metrics AND self-reported ones in order to get robust data, by which I mean data that covers dimensions of speed, quality, and maintainability. Some metrics, like PR throughput and deployment frequency, can be measured using system data from source control and build tooling, but metrics like “change confidence” and maintainability are critical to avoid longer-term negative impacts of AI. These can only be measured through self-reported data from developers themselves.
If these topics don’t already come up in team discussions about AI, add them to the agenda. Even though this feedback is unstructured, it provides a richer understanding into existing concerns, and you can discuss proposed solutions and monitor progress over time.
In order to correlate AI usage with changes in quality and maintainability over time you’ll want more structured data, and for this, a periodic developer experience survey is a good approach.
Here’s two questions that help organizations understand change confidence and maintainability, specifically:
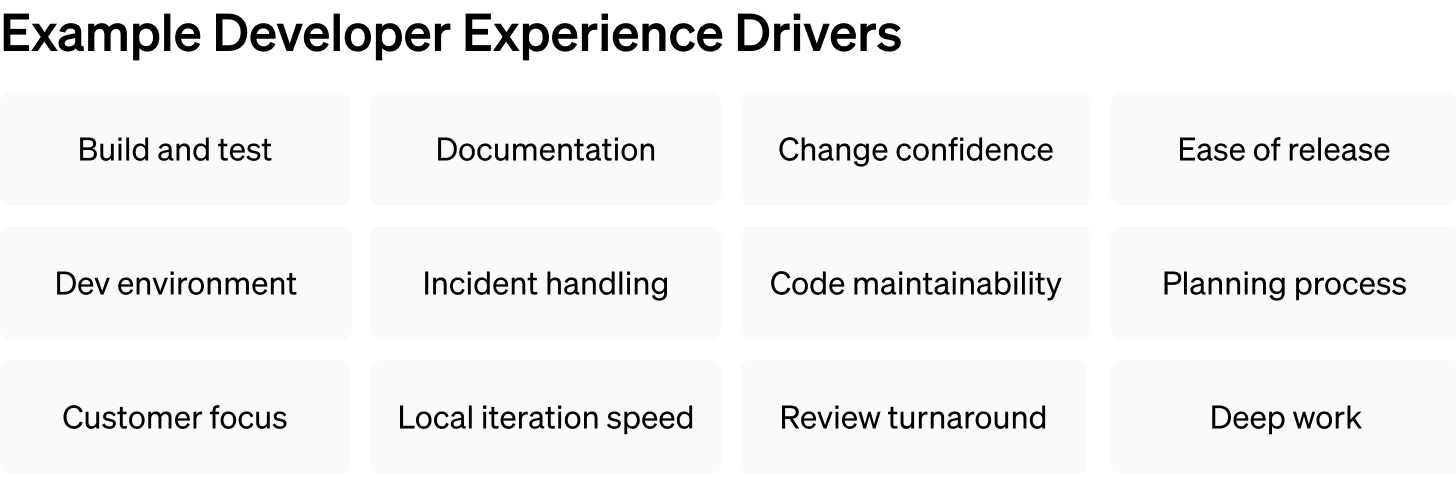
Developer experience as a whole is another popular measurement to counterbalance speed and quality. It’s worth noting that developer experience has a slight marketing problem; it can easily come across as “ping-pong and beer”, instead of what it actually is: reducing friction and drag in the development process. DevEx includes all parts of the development lifecycle, from planning, building, and testing, release processes, all the way to production support.
With AI tools, the risk is that we remove friction from some places like code authoring and testing, but then add friction in other places, like code reviews, incident handling, and maintainability.
Shelly Stuart, Director of Engineering at CircleCI, shares more about the importance of developer experience and developer satisfaction in the context of AI-assisted engineering:
"Developer experience tells us the story behind the numbers. While output metrics like PR throughput show us what is happening, developer satisfaction reveals whether it's sustainable.
We know that AI tool adoption can temporarily frustrate developers. Tracking developer experience alongside business outcomes helps us distinguish between short-term friction and long-term value. Without measuring satisfaction, we'd miss critical insights about whether our AI investments are enhancing our engineering culture, or if they are creating new areas of friction that we need to overcome."
If a tool has outstanding technical capabilities, it doesn’t matter if developers don’t actually like using it. Three-quarters of companies mentioned in this article also measure developer satisfaction or CSAT with AI tools, which is a good signal that the focus isn’t only on speed gains, but on building sustainable engineering practices that reduce friction in daily tasks.
5. Unique metrics, interesting trends
There are interesting details hidden in all the metrics which caught my attention. While the industry has largely aligned on measuring time savings, quality, and speed, I find it interesting to look into outliers to learn about how different companies operate, and also to see what these metrics don’t show.
Microsoft uses the concept of a “bad developer day” (BDD) to assess the impact of AI tools. It’s a real-time look into the toil and friction of devs’ day-to-day work, whereas developer experience surveys provide a lagging indicator. The idea is that AI should reduce the frequency and severity of BDDs. If so, Microsoft can determine whether AI is truly reducing friction, or is introducing new obstacles into the workflow.
Several factors can turn a day from good to bad:
Time spent mitigating incidents and addressing critical compliance issues
Time in meetings and email, including context-switching costs
Time managing tasks in a work tracking system
The company takes these factors and balances them against measurements of PR activity, which serve as a proxy for coding time. The reasoning is that a day might include some tasks that are toilsome or feel low value, but if the developer still gets some time to code and submit changes, this can tip the balance toward having a good day.
Glassdoor measures experimentation as an outcome of AI tools. They track the number of A/B tests per month to understand whether AI tools are helping developers innovate faster. AI is an incredible tool for experimentation and prototyping, so it’s interesting to see an experimentation metric like this as a top-level AI impact metric. Relatedly, Glassdoor is doing nice work in turning power users into internal advocates for AI.
They also use an uncommon measurement called “percentage capacity worked,” sometimes called “capacity utilization rate,” to measure each AI tool. This metric looks at the total potential capacity and actual utilization. This helps to reveal when a tool’s capabilities or adoption might be hitting a plateau, which is a sign to reallocate budget toward more capable alternatives.
These days, acceptance rate is rarely measured. At one time, the percentage of AI coding suggestions being accepted was the leading AI metric. Now, we see it waning in popularity because of its narrow scope. This may be because acceptance rate focuses on the moment of suggestion, but misses a lot else, like:
Whether accepted code is maintainable
Whether an accepted change later gets reverted
Whether the suggestion introduces bugs
Whether it actually helps developers feel more productive, overall
Many companies don’t track the acceptance rate as a top-level metric anymore, but there are a few exceptions:
GitHub builds its own AI tool (Copilot), and tracking the acceptance rate helps them understand direct usage and guide product decisions.
T-Mobile includes acceptance rate in their metrics, and shared that they use it as a data point to help determine how much AI-authored code makes it to production, which is an incredibly challenging problem to solve for many companies.
Atlassian and other companies track acceptance rate as an additional proxy for developer satisfaction with the tool, and to see if it is actually suggesting good code.
Spend and cost analysis isn’t widely measured, but this could change soon. Today, most organizations want to avoid discouraging developers from using AI by explicitly tracking spending. Some companies like Shopify have taken the opposite approach of introducing an AI Leaderboard to see which developers spend the most on token consumption, and then celebrate that experimentation.
Still, companies need to ensure AI investments deliver a clear return on investment, and that the AI budget is worth it. ICONIQ’s 2025 State of AI report showed that internal AI productivity budgets are estimated to double this year compared to 2024. Most of this money is coming from R&D budgets, but some companies are reallocating headcount budgets to pay for AI tools that drive internal productivity. Basically, some companies plan to hire less in order to spend more on AI tools.
We’re already seeing prices going up (no more $20-a-month!) and companies are trying to forecast their costs for the next year with token consumption and new tools coming on the market. All of this points to more price sensitivity, which means more scrutiny with measurement.
Agent telemetry is not measured today – but this will likely change in the next 12 months. Agent-specific metrics are also largely missing, right now. At this stage, most teams aren’t yet breaking down AI impact to that level of granularity, and the telemetry data itself remains limited. Autonomous agentic workflows will continue to gain traction in the next 12-18 months. Indeed, this is one area of measurement that we expect to change to better reflect how companies use these tools in day-to-day work.
Outside of coding-related activities, there’s little measurement happening. There’s not much direct measurement of AI tools beyond code authoring. It’s predicted that 2026 will be a big year for AI across the whole software development lifecycle (SDLC), and measurements will need to evolve to keep up. Use cases that are more concrete, such as code reviews and vulnerability scans will be better suited for telemetry, whereas ones whose output is more abstract are harder to measure because there’s not such a straight line between activity and impact.
Even now, some companies limit their measurements to AI code assistants within the IDE or terminal, and don’t always count a planning session with ChatGPT, or using AI to sift through thousands of Jira tickets, as part of “AI-related time savings.” In the area of self-reported measurements of AI impact (e.g., “how much time did you save this week thanks to AI tools?”), I expect the surface area of measurement to expand to keep up with different types of tools.
6. How should you measure AI impact?
What can you take away from all these metrics, and what should you implement in your own workplace?
A few months ago, Abi Noda (co-author of the DevEx Framework) and I released the AI Measurement Framework. We worked directly with some of the companies I interviewed for this article in order to go deep into the measurement gaps they had. We had a front-row seat for decisions they needed to make with the data, and we were able to see firsthand what worked and what didn’t. We also collaborated with other researchers to include the past decade or more of developer productivity research into our recommendations.
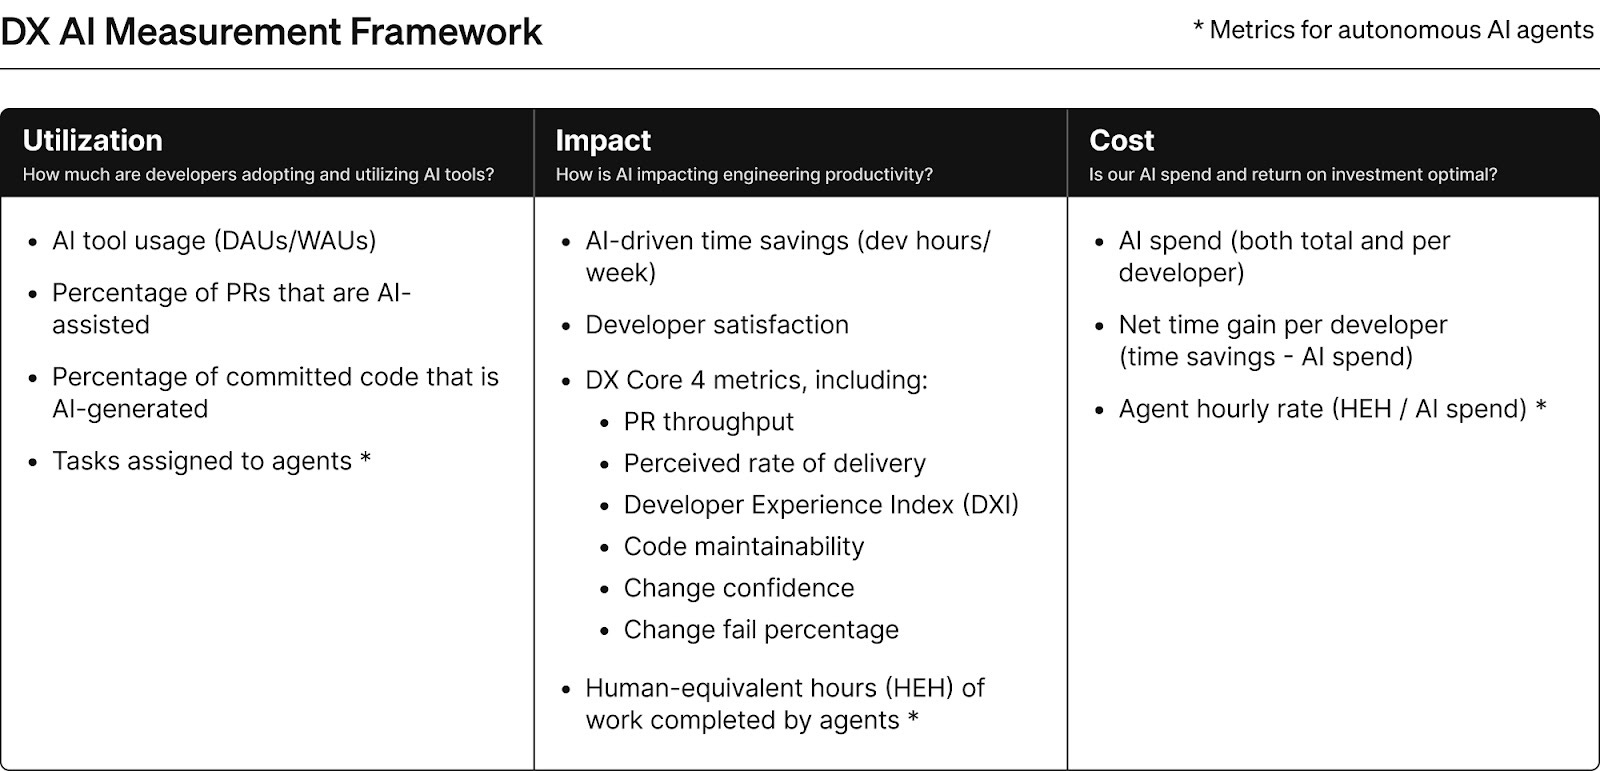
This framework is a blend of AI metrics and core metrics that show how and where AI is being used in your org, and most importantly, what the impact is on overall performance. Speed, quality, and maintainability are all represented, and we recommend keeping developer experience in the center. As with any framework, all of these measures need to be looked at together. No single metric in this framework is a good-enough measure by itself, especially the percentage of committed code that is AI-generated – however much it makes for a good headline.
The framework covers what to measure, but we’re still left with how.
To capture the many dimensions of AI impact, you need both qualitative and quantitative data. This is already well established when it comes to developer productivity, and the pattern also holds true for AI impact. Looking at the metrics from companies interviewed for this article, all mix system-level workflow metrics like PR throughput or DAU/WAU of AI tools, with self-reported data like the CSAT of AI tools, or time savings per week. Almost all companies mentioned in this article use DX to capture this data, although it’s possible to build custom systems for collecting and visualising it.
There are a few ways to gather this data:
Systems data (quantitative measurement). Most AI tools offer admin APIs to track usage, spending, token consumption, and code suggestion acceptance. Alongside this, you can bring in system metrics from your development stack – such as GitHub, JIRA, CI/CD pipelines, build systems, and incident management.
Periodic surveys (qualitative). Quarterly or regular surveys help capture longer-term trends in developer experience that systems data alone can miss. Surveys aren’t just about perceptive measures like developer satisfaction, change confidence, or code maintainability, which are impossible to get from systems-level data. You can also measure things like PR throughput, change failure rate, and the percentage of PRs using AI with self-reported data. This type of surveying is also a good way to get measurements in areas where telemetry isn’t available or practical.
Experience sampling (qualitative). This method gathers targeted, in-the-moment feedback by asking brief questions during key workflows. For example, after submitting a pull request, you might ask if AI was used to write the code, or whether AI-generated code felt easier or harder to understand.
A periodic survey is the fastest way to get started, and will provide a mix of self-reported workflow data (PR throughput) as well as perceptive data that’s impossible to get from system data alone. You can deploy a survey and get access to data within a week or two, and the data collected is typically the right resolution for most decision-making. Remember, the more precise the measurement, the more expensive it is. When you’re hanging curtains, it’s okay to be off by a millimeter or so; not so much when you’re building a rocket. Most decisions we make as engineering leaders are curtain-hanging decisions, not rocket-building decisions, and we need enough precision to go in the right direction.
Over time, you can introduce other types of data. Layering data collection methods allows you to cross-validate findings from multiple data sources. For example, ask for developers’ perception of quality practices while also tracking change failure rate and the number of incidents.
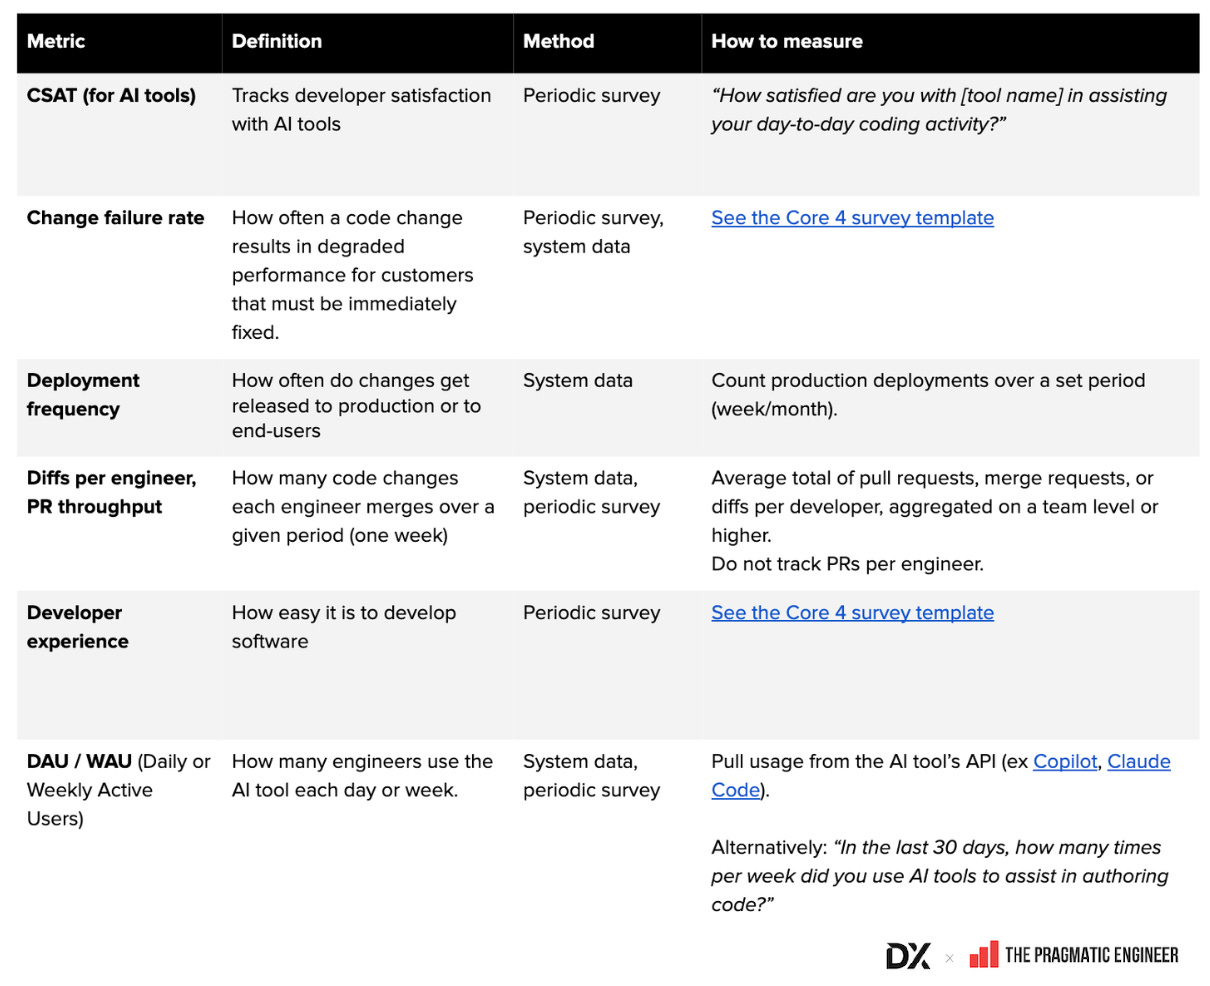
Definitions and calculation methods for common AI metrics. As you take these concepts and apply them to your own teams, use this glossary (a Google Sheet) of common AI metrics to figure out how to define and collect the data. You can find a full glossary of AI metrics and developer productivity metrics below:
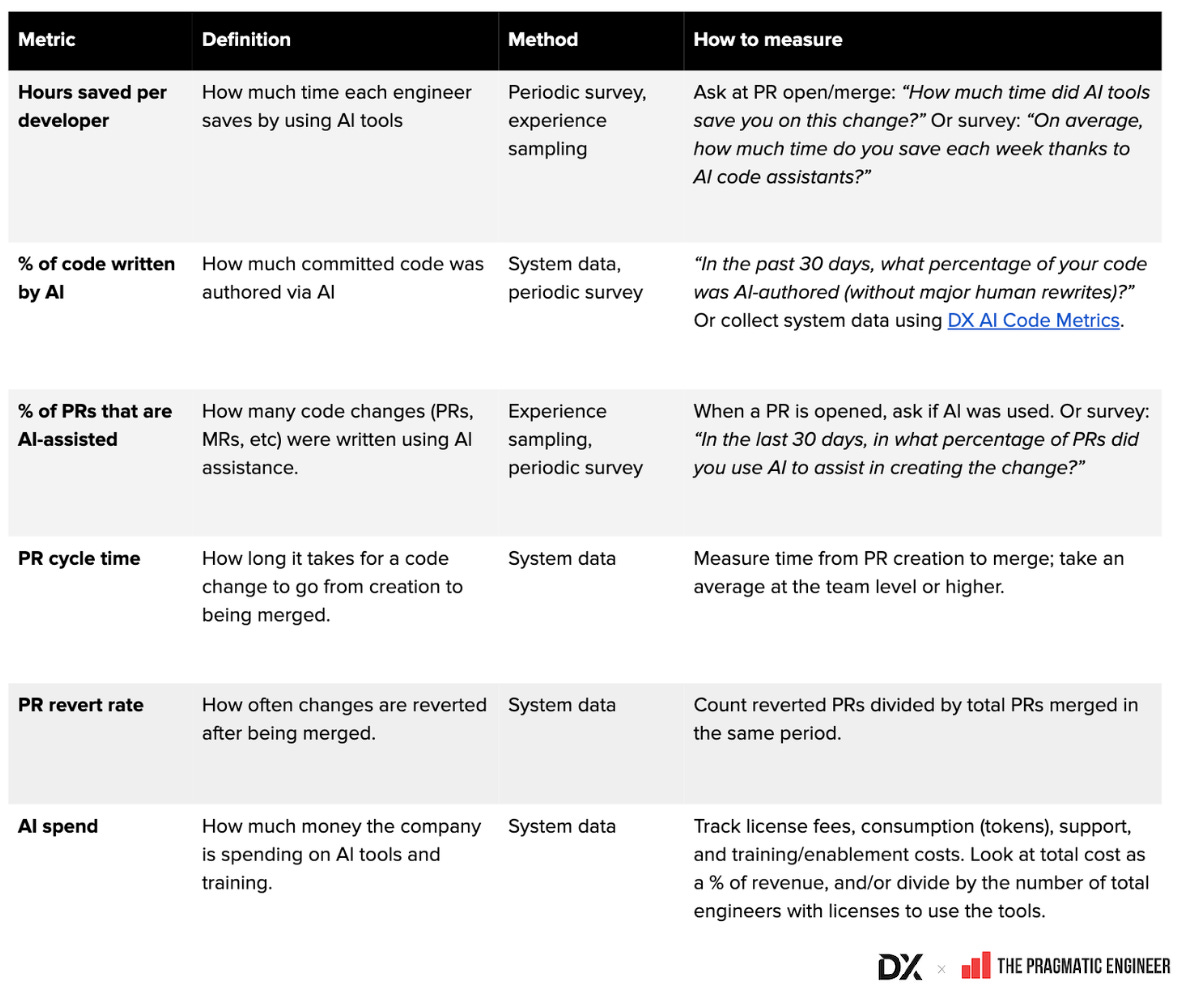
How to bring these ideas in-house
The companies I interviewed for this article don’t have all the answers on AI strategy, but they have enough visibility into what’s happening that they can tell soon enough if something isn’t working.
Remember, we’re not just chasing adoption here, or any single metric. We’re trying to see if AI is helping our organization get better at delivering high-quality software at speeds that solves customer problems. We use metrics to understand how, where, and why AI is achieving those outcomes or not, so that we can double down or change our approach.
Think about your own AI measurement strategy. Can you answer this question:
“Is AI making us better at the things that already matter, like quality, fast time to market, and frictionless developer experience?”
If the answer is “not yet”, here are some discussion points to take to your next leadership meeting.
Do we have a solid definition of what engineering organization performance looks like?
Do we have data on how we were performing before AI tools? If not, how can we get to a baseline quickly?
Are we mistaking AI activity for AI impact?
Do our measurements balance speed, quality, and maintainability?
Can we see how AI tools are impacting the developer experience?
Do we have a layered approach to measurement, looking at both system and self-reported data?
7. How Monzo measures AI impact
Gergely here, again. Thanks very much to Laura for collecting all these details from no less than 18 companies. To close this deepdive with something more specific, Laura and I did an interview with the team at Monzo Bank, to understand their journey into learning how well AI tools work for their software engineers. Monzo is good for this because it has a strong engineering culture, and people there keep their feet on the ground by not buying into AI hype.
Suhail Patel leads the platform teams at Monzo Bank, which is an innovative neobank. We asked how the team figures out how well their AI tools work. My questions are in italic, with Suhail’s answers in quotes.
What were the first AI tools you introduced at Monzo?
The very first one was GitHub Copilot. That's going to be quite a common answer for most companies, mostly because I think GitHub played their strategy very well, as Copilot ‘sneaked’ its way into VS Code. It wasn't really a standalone line item. A GitHub representative got in contact and told us GH Copilot was now part of our GitHub license and enterprise. They encouraged us to use it and onboard all engineers.
This was the first time when engineers really started to ‘kick the tires’, especially around agent mode and working with GitHub chat, Copilot chat, and using the enhanced AutoComplete. People really got a sense of what is possible with these tools.
Since then, we’ve been trying Cursor, Windsurf, and Claude Code, and we continue to invest in Copilot”.
What’s your advice for engineering leads about evaluating AI tools?
“Our philosophy is that we would be foolish not to stay on top of this fast-changing tooling landscape. We could have just kept using GitHub Copilot, but so much keeps changing! Until you try these tools yourself, all you have is speculation.
So, the best advice I have is to get first-hand experience across a variety of tools and use cases. You want engineers on your team who use these AI tools on their code, day after day. You want them to have created their own agents.md files, and only with regular usage will you know how well the tool works. You want to give as much context as you can for the tools in order to see what they can actually do.
Also, it’s hard to evaluate these tools objectively; sometimes you need to be okay with some evaluation being subjective. The ‘objective’ numbers we measure are about usage and local performance. We then run a lot of DX surveys to get a sense of what engineers think about them”.
How can you tell if AI tools actually work and are worth the money?
“This is the million-dollar question, right? I'd be lying if I said we have the one single answer. A lot of it right now is subjective. If engineers are sentimentally feeling that the tools are providing them value: this is valuable enough, for now!
It’s not just writing code where AI tools help engineers. Our engineers tell us they feel that the tools help them to:
Retrieve relevant documentation easier and faster
Summarize better
Better understand code
… and in general, just having less cognitive load with the right types of tools
We’re in a highly competitive market and you want your engineers to have access to the best tools. If we don’t allow our engineers to use best-in-class tools, including AI coding tools, while other startups do then our engineers will get frustrated and move elsewhere!”
Why is it so hard to measure how well these AI tools work, and what are you measuring?
“Honestly, it’s frustratingly hard to measure how much these tools help move the business forward. For example, how can we tell if we are getting a 30% efficiency increase within our organization as a result of code that's been generated with AI?
If we have to spend an equal amount of time fixing up AI-generated code as we spent handwriting the code, then we’ve made no progress!
The problem is, when you have an AI tooling vendor – be it Microsoft, Google, or someone else – they measure what they can, and that’s the number you get! They can only measure proxies like acceptance rate. Most organizations are not set up to measure AI’s impact on the business accurately – and that includes us, today.
Of course, you could theoretically A/B test this with one team using AI tools and the other one not – but let’s be honest, this is not practical. I don’t think this space is A/B testable, at least not for most teams.”
To properly measure the impact of AI, you’d need to pull telemetry from vendors that don’t really want to give you the real numbers. If we needed to get accurate usage numbers, we would need to pull through statistics from so many different tools – GitHub Copilot, Gemini, Google Workspaces, Slack, Notion, and others. All of these tools have AI features – but if you want to capture all AI usage across all these tools, it’s close to impossible! Vendors have this selfish motivation to make the telemetry obscure because they want to continue their moat and their lock-in. It's very, very hard to get the actual usage telemetry you care about, such as: “show me how often AI features were used in this tool, and what the users got out of that usage.”
Unfortunately, today the only way to get this data is a very invasive way: install agents on laptops to track where engineers spend their time. To be super clear, I am no advocate of this, and we don’t do it. But failing this option, all you’re left with is mostly subjective feelings on what works and what doesn’t!”
Which areas do these tools work really well in?
“AI tools are really good at helping us with migrations. When we're doing things like code migrations, or introducing new libraries and dependencies, these tools can stitch together code modifications, then draft most of the migration until it gets too complicated and an engineer needs to step in. It feels like we’re saving 40-60% of the previous effort of migrations with these tools.
As an example, a big project we are undertaking is annotating our data toolchain. This work means that engineers need to define subjects and entities for a bunch of existing data models. It is a very manual and laborious process.
Now, using LLMs and wrapping it with tooling, we can potentially make a first pass with them. Engineers then go through the modifications and correct whatever the tool got wrong.
LLMs are taking care of a large chunk of the grunt work in these well defined cases, and engineers deal with the remaining bits. This feels like a huge win, so far! And it’s a use case where engineers tell us they feel they’re getting upside from these tools.”
What is something counterintuitive that you’ve learned about AI dev tools?
“It feels to me that engineers haven't really got the nuance of how much these LLMs actually cost. If people were able to get a bill from their organization for their actual AI usage costs, optimising usage would become a bit more prominent.
I’ll give you an example, if you use BigQuery on Google Cloud when you write a SQL query, it will try and predict how much data needs to be scanned – and you get a sense of the associated time and resource cost this might involve. For example, it might tell you “this query will scan 10GB of data.” And you’ll probably go “oh, that’s peanuts, LGTM (looks good to me).” But another time it will tell you “oh, this query will scan 500TB of data.” And you’ll probably say “whoa, I probably don’t need all this, I should take a step back.”
We had a similar experience with Copilot code reviews, where we got little value for a lot of LLM usage. We turned on the automatic GitHub Copilot review. The tool spent a bunch of tokens giving us code suggestions. However, we found these suggestions were not actionable! So there we were spending tokens, and slowing down engineers who had to review suggestions that made no sense.
So, we turned off this review by default. Engineers can still request a Copilot review – but it’s now opt-in.”
Which areas have you decided to NOT use AI tools in, at all?
“We decided not to use AI for really important areas of the business. For example, we have firmly resisted AI for things like:
Areas that store any type of customer data, even if sanitized
Our data warehouse, which has fully redacted customer data, but is queryable by engineers
And until we have very strong confidence, we don't want people to be playing “fast and loose” with customer data.
Every now and then when I instruct Cursor to write a shell script, it will suggest some random license key or API key that someone else put in their environment, and which Cursor’s agent indexed. We don’t want the same thing to happen with any business-sensitive data.”
What’s your overall thinking about AI coding tools and software engineering?
Here’s my philosophy on these. As a platform team, we should:
Provide guardrails: ensure these AI tools can be used safely by engineers, without worrying about things like data leakage
Share examples: helpful cases and success stories about when these tools worked or flopped.
Share prompts more widely: we want to be very transparent about prompts that haven't worked out, or where someone wasted half a day trying to get a prompt to work when that time could have been spent actually fixing the problem they were trying to solve in the first place.
Share positives and negatives more widely: having both sides of the story is really, really key. This is not about saying “the AI skeptics are right!” or “the AI proponents won here.” We want to provide a balanced take.
Remind people of LLMs’ limitations. We want to remind people to continue to appreciate the limitations of AI tools because everything has limitations; humans have limitations and LLMs are no different.”
Takeaways
Many thanks to Laura for her research and getting data on how the companies in this article measure AI efficiency, and also to Suhail for sitting down to talk through what they see on the ground at Monzo.
Measuring the impact of AI is very new, and there is no one “best practice” for it. Companies that are similar enough in size and operate in similar markets like Microsoft and Google, measure different things around AI. The tables above showing what the companies measure illustrate that each place has a different “flavor” when it comes to measuring AI efficiency.
Measuring conflicting metrics is common – almost all companies do it. The most common example is measuring change failure rate (or similar metrics like frequency/percentage of bugs shipped), while also measuring pull request frequency. The first metric is about reliability, and the next is about speed. Shipping faster only makes sense when it doesn’t result in an impact on reliability; so you want to measure both!
Measuring the impact of AI tools on engineering teams is a similarly hard problem to measuring developer productivity. Accurately measuring developer productivity is tricky and the industry has struggled with it for well over a decade. We know that there is no one single metric that can tell us how productive an engineering team is because teams can simply optimize for any one metric while not actually being more productive. In 2023, consultancy giant McKinsey confidently declared that they’d “cracked” how to measure developer productivity. But the creator of the extreme programming methodology, Kent Beck, and I, were skeptical of this claim, and we published a counterpoint in the article Measuring developer productivity? A response to McKinsey.
Until we figure out how to measure developer productivity, I don’t think we’ll fully crack how to measure the impact of AI tools on developer productivity. Still, while there’s no grand solution, we should still experiment with how to better answer the question: “how are all these AI coding tools changing the daily and monthly efficiency of individuals, teams, and companies?”
 | A guest post by
|
One thing I find challenging is: how do you know that the positive impact in the engineering organization comes because of the usage of AI or just because the teams become better (maturity) at their job?
In order to know if the positive impact comes from the usage of AI tools, do you use some kind of rule? like, "if the usage of the AI tools is >X% and we see a positive impact, then we can conclude that it is thanks to the AI usage".
Super useful article, thanks a lot, Laura!
I cannot stress more: I dream of the day that AI takes the Product Manager's specs and deals with Jira management, scheduling the sprints based on current capacity of the teams, and deal again with Jira tickets... 😅